Last week I wrote about the critical nature of your company’s current ratio. This week we will cover:
Current Ratio vs Acid-Test Ratio
.
Your acid test is the next balance sheet ratio to pay attention to. It is critical because, like current ratio, increasing acid test means increasing ability to pay your bills and increasing profitability, most of the time.
Decreasing acid test means that your profitability is decreasing and your ability to pay your bills is decreasing, most of the time.
Like the current ratio, when these trends are because of purchasing assets for cash, paying a huge tax bill, loans (such as the PPP loan that many companies received during the pandemic), or other huge cash increases or decreases not dependent on your day to day business operations, the trends do not follow the same rules as above.
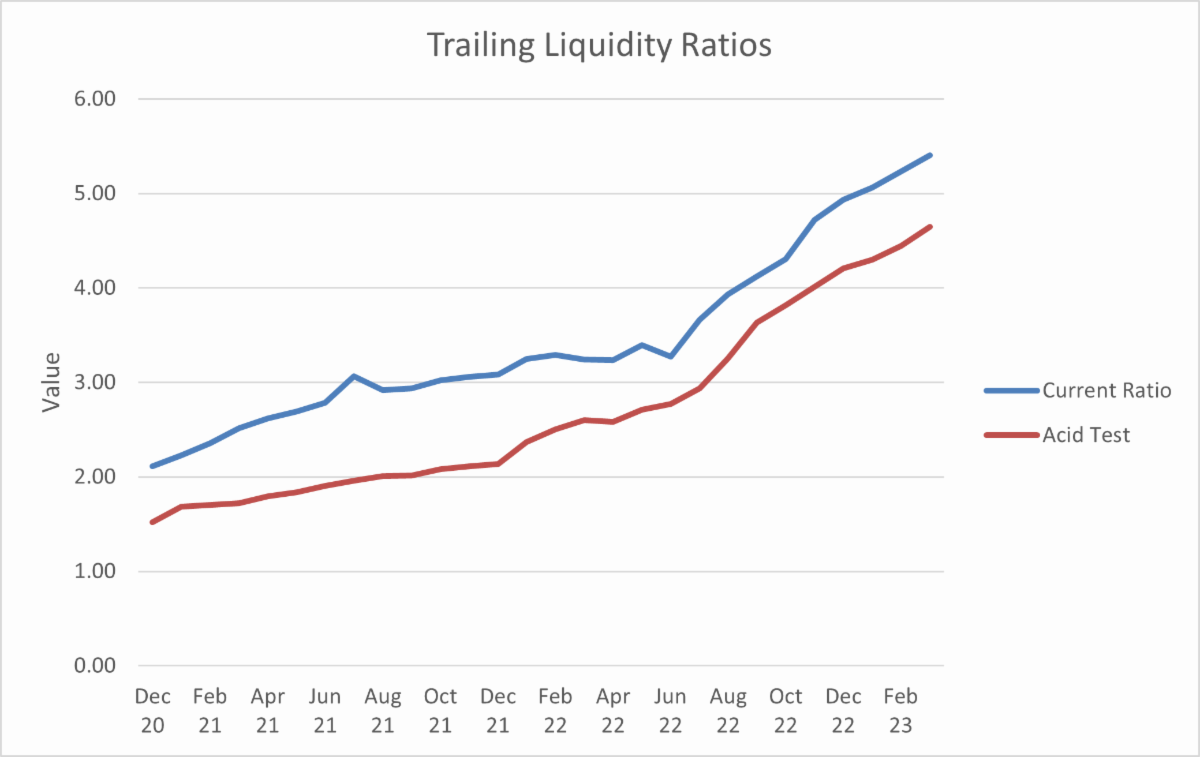
The critical thing to look for is the comparison of the current ratio to the acid test. The two lines should be parallel. If they are widening, you are building inventory. If they are coming together, then you are using more inventory than you are purchasing.
Acid test is defined as current assets minus inventory, then divide by current liabilities.
Current assets are either cash or things that can be turned into cash within a year. The major categories of current assets are cash, investments, accounts receivable, inventory and prepaid expenses. Occasionally you’ll have some other current assets. However, on an operational or day-to-day basis, you’ll generally have these categories.
Current liabilities are debts that must be paid within one year. The major categories of current liabilities are accounts payable, accrued taxes (payroll taxes, income taxes, state taxes, local taxes, etc.), deferred income, warranty, and current portion of long-term debt.
Like the current ratio, an individual month’s ratio tells you almost nothing. Graph your acid test trends using trailing data (a year’s worth of data taken a month at a time). For example, the acid ratio for April 2025 is the addition of the acid test ratios from May, 2024 through April 2025 divided by 12). It is the trend that matters. Is the ratio increasing or decreasing? Is the link parallel to the current ratio line? And why?
Your trailing current ratio and acid test graphs should look like the graph above.
You can spend the hours to calculate the ratios and graph them yourself or you can have software calculate the ratios and graphs for you in less than 10 minutes a month.
Go to www.financiallyfit.business to subscribe. Click here to schedule a demo!
Books/Audios that could help your business and you.

A quick and easy read to help you interview more thoroughly so that you can make a better decision. Click here to order on Amazon: https://amzn.to/4iwFNxB

