How Small Changes in Your P&L Statement Reveal Bigger Business Problems
“It’s just a little bit so I don’t have to worry about it.”
A little change in the trends on a trailing basis means a lot.
You should be concerned if the trend is going the wrong way. Investigate why.
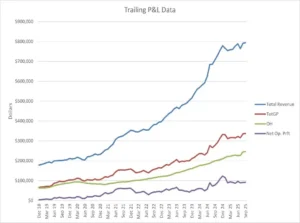
The Profit and Loss graph above demonstrates a “subtle change” and a “big change.”
First, the big change –overhead (the green line) Is rapidly increasing. Why?
The subtle change – the spread between revenue and gross profit (the blue line and the red line).
Revenue and gross profit lines should be parallel. This means your gross margin is consistent. If the lines are spreading, then direct costs are increasing – usually either suppliers have increased costs and prices have not been increased accordingly or productivity has decreased.
A slower revenue month is not the answer if your pricing is consistent in slower and busier months (gross margin should remain the same). However, if the company gave discounts in slower months, this could explain the spread between the lines too.
Join me for this month’s Ask Ruth’s webinar – I’ll be diving deep into this graph and other financial graphs where “subtle changes” mean a lot.
Click here for more info and to register for this complimentary webinar.
How financially fit is your business?
Click here to take this one-minute assessment

Books/Audios that could help your business and you.
AI Search Revolution describes the next phase of search. Google is no longer enough. If you don’t want to read it, give it to your marketing team and make sure that they are following the suggestions so that your company doesn’t get lost in the AI search world.
Click here to order on Amazon: